MZ Weekly Thread for February 10, 2025
Chart, graphs and links on inflation, jobs growth, cloud data centers and hyperscalers revenue and growth forecasts, U.S. trading partners, China electronics tariffs, global manufacturing value-add, U.S. jobs growth, Australian export partners and more.

This week I post data on inflation, jobs growth, cloud data centers and hyperscalers revenues and growth, U.S. trading partners, China electronics tariffs, global manufacturing value-add, U.S. jobs growth, Australian export partners and more.
“We're still growing at a pretty reasonable clip, as I mentioned earlier, but I do think we could be growing faster if we were unconstrained. I predict those constraints really start to relax in the second half of '25.” - Andy Jassy (AMZN CEO)
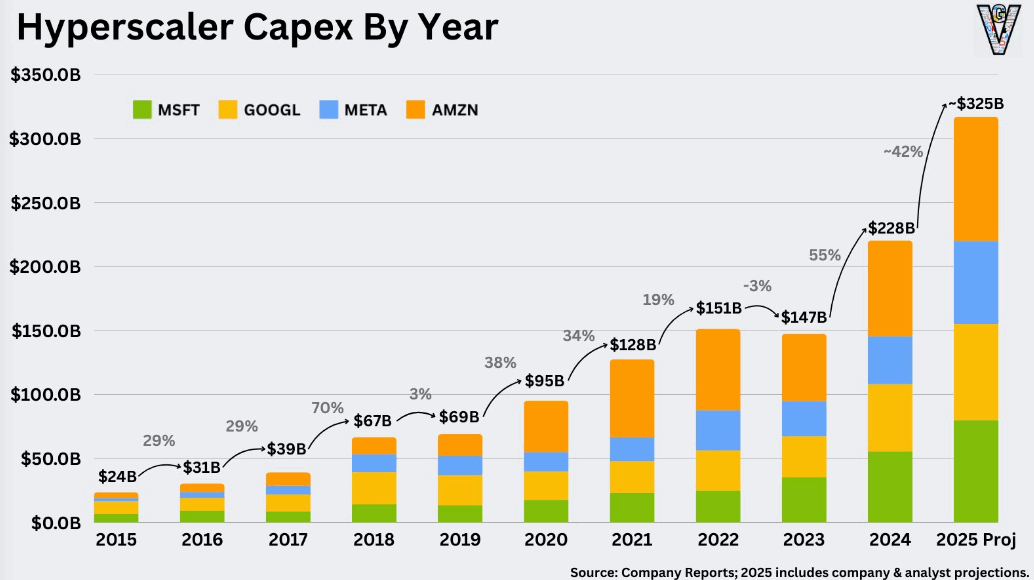
Alibaba cloud revenue. Chart courtesy Lloyd James Ross on X @lloydjamesross
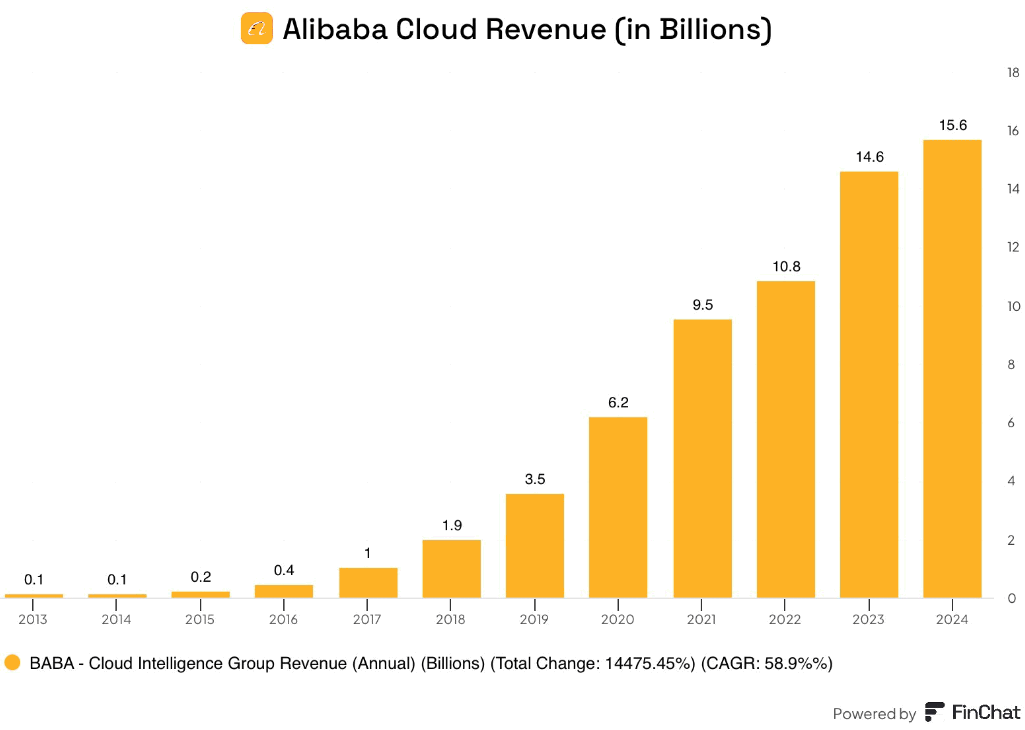
Below, Google's revenue by segment chart. "Google previously operated through server-sensor model. It collected data through sensors on web like crawlers and redistributed it through advertisement. This model worked well when it was other people who used the data. You could always find somebody to pay for data because it helped their businesses. This is changing now.
Data will be used not by humans but by machines, AI models, and people will be using models. In this model, power doesn’t lie with the data distributor, it lies with the infrastructure provider where AI models run. You must own the cloud platform and power it by yourself." This quote is from Oguz O., writer of the Capitalist-Letters newsletter, on X @thexcapitalist.
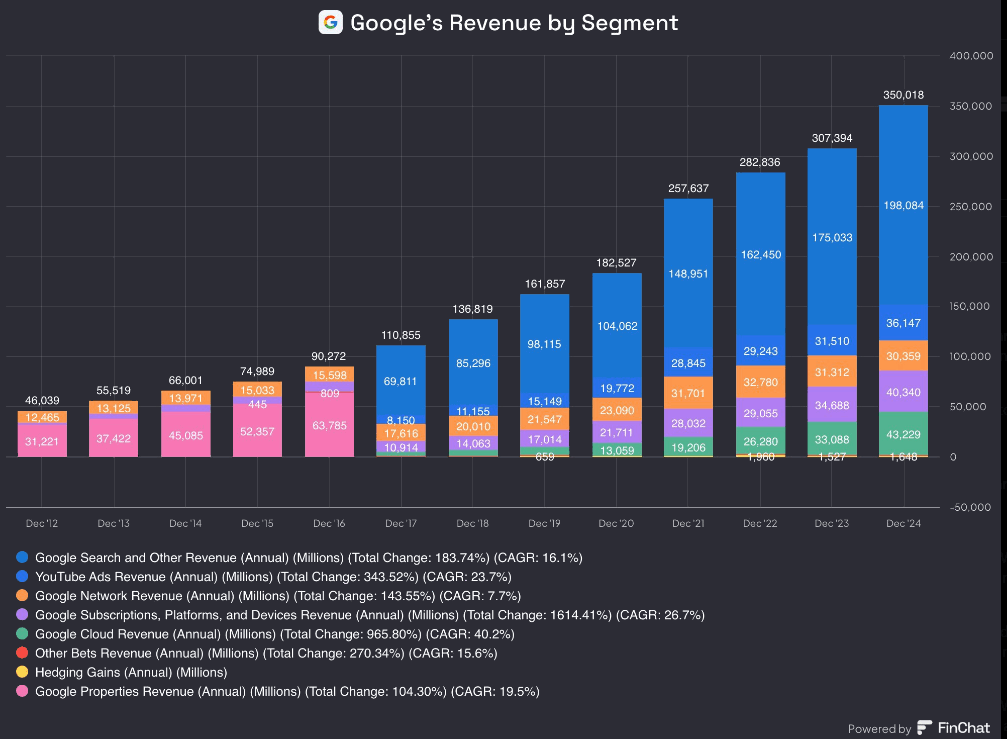
Also from Oguz, Amazon's annual revenue by category.
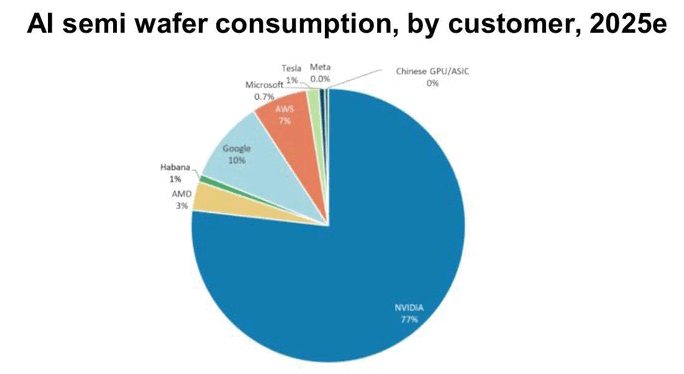
AI computing wafer consumption could hit US$14.5 billion in 2025 with Nvidia accounting for vast majority according to research report by Morgan Stanley Research courtesy, Eugene Ng, founder Vision Capital Fund on X @EugeneNg_VCap.
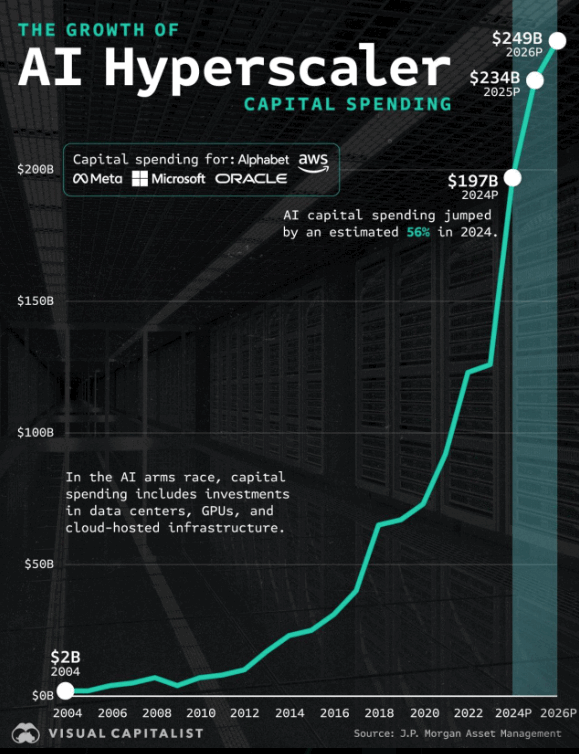
"The AI story continues the broadening out of the market opportunity will become more evident in 2025. The continued work to bring more efficient, high-performing, silicon, networking, and applications will remain a focus for the entire. But anyone that thinks we’ve hit the peak of infrastructure is completely missing the point," says Daniel Newman, CEO The Future Group on X @danielnewman.
_________________________________________________________
About
What matters when formulating contract electronic strategy? How do you identify supplier profit centers and what are you doing to protect against margin erosion for your outsourcing programs? Why do provider capabilities often not match capabilities they claim? How are you benchmarking your supply chain against competitors?
I’ve spent 25+ years in contract electronics industry setting up contract electronic divisions and running operations, protecting EMS program profits, manufacturing capacity M&A and more. I run a technology solutions firm. A lot of times this means asking the right questions.
_________________________________________________________
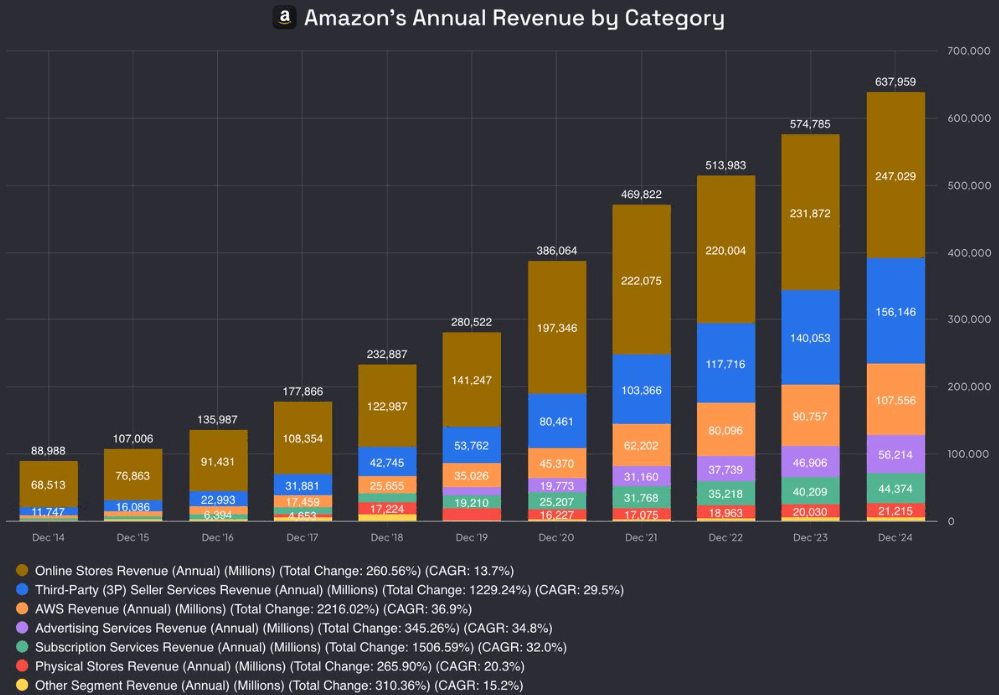
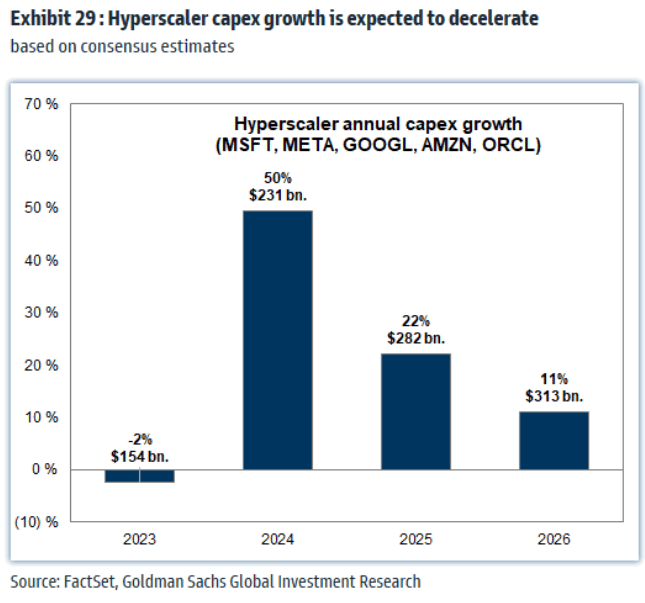
A contradicting report from investment banker Goldman Sachs indicates hyperscaler capex growth is expected to decelerate. Chart courtesy Mike Zaccardi, financial writer on X @MikeZaccardi.
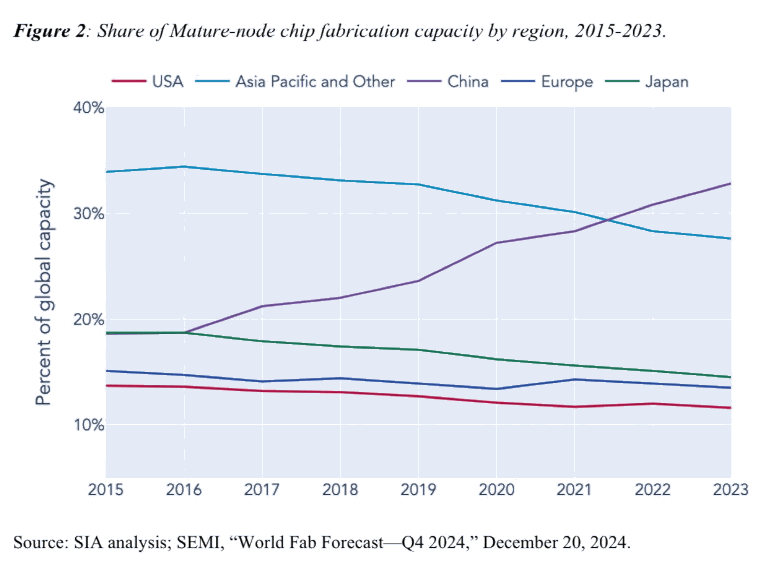
Below from Semiconductor Industry Association (SIA), this chart visualizes percent share of mature-mode semiconductor chip manufacturing capacity by region for USA, Asia Pacific and other, China, Europe, Japan.
From Kearney, [mature-mode] chips are "manufactured using older technology (in other words, 22nm, 28nm, 32nm, and 45nm process nodes). While mature node semiconductors don’t elicit the same level of excitement as their advanced counterparts, they have many practical and lucrative applications—such as use in telecommunications equipment, computing, automotive, memory and storage, and cloud equipment."
Chart through 2023, published December 20, 2024.
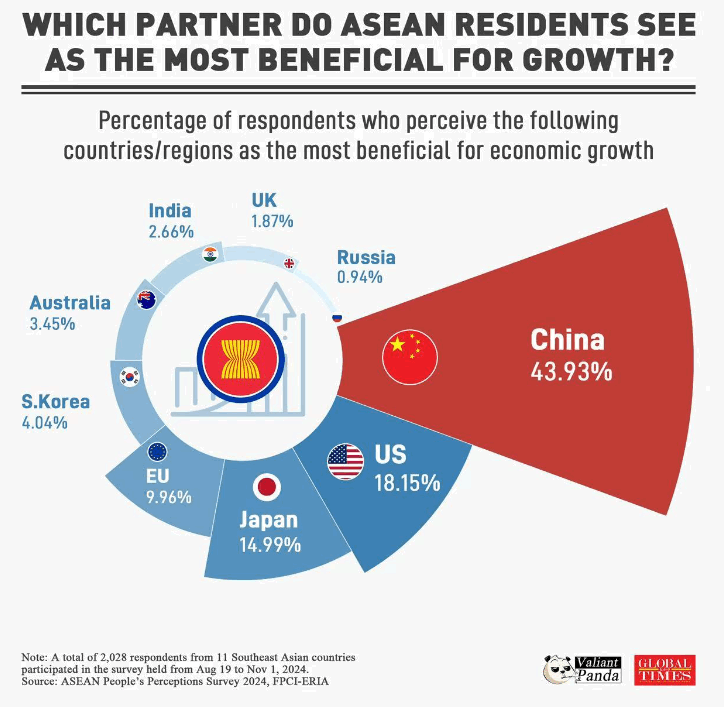
A survey with 2,028 respondents from 11 Southeast Asian countries for ASEAN People's Perceptions Survey 2024 found China the most beneficial partner for economic growth. Chart courtesy Jason Smith, American journalist in China on X @ShangguanJiewen.
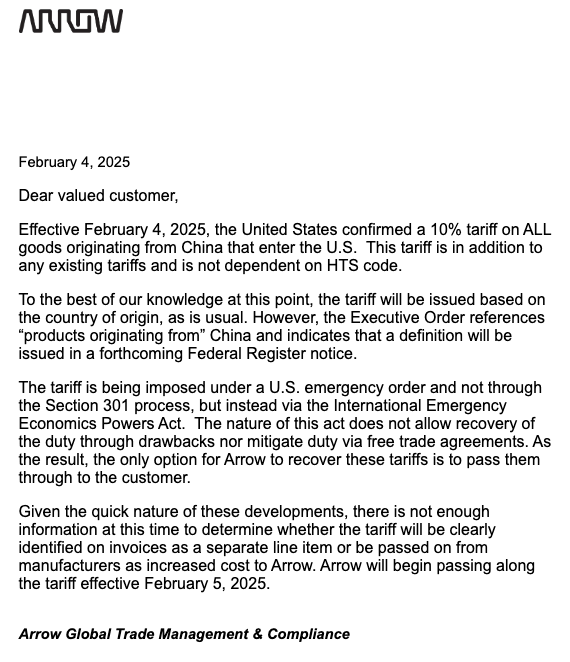
Electronics distributor Arrow office of Global Trade Management and Compliance emailed customers the following message: "Please note that the US Government has implemented an additional 10% import tariff on all imports from China:
- 10% tariff on ALL goods originating from China entering U.S.
- This tariff is in addition to existing tariffs and is not dependent on HTS code
- Incurred import fees will be passed on to the customer
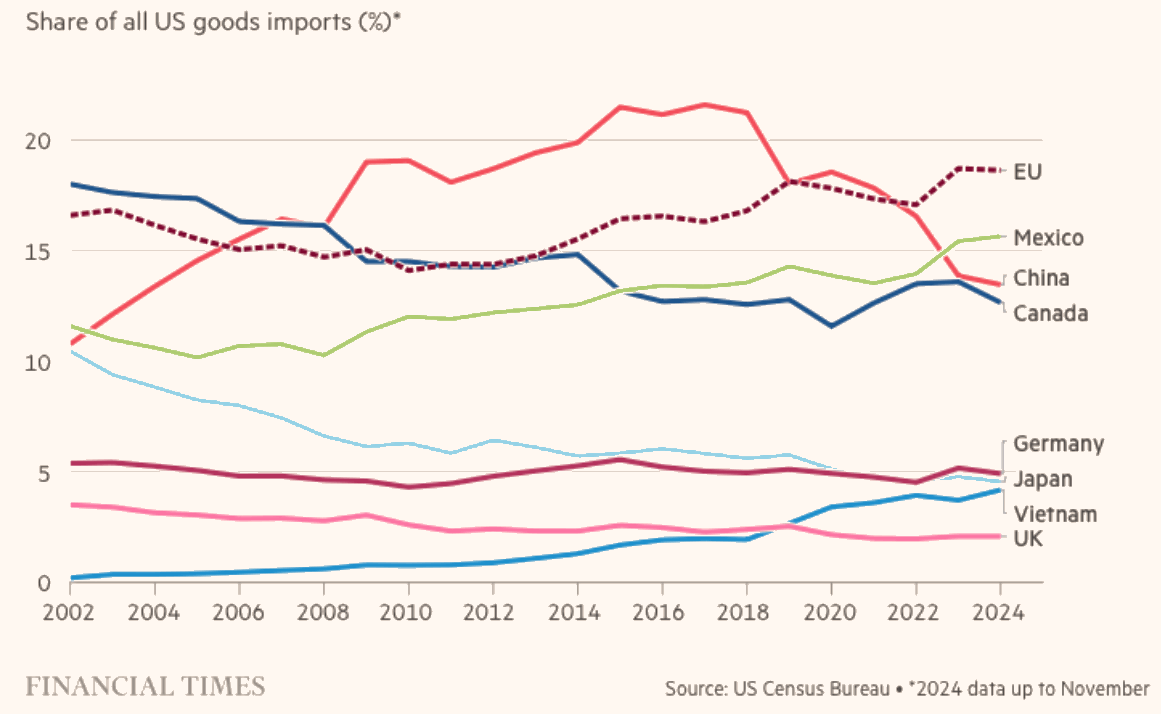
The European Union has the largest share of US goods imported, ahead of Mexico, China, Canada. The EU is more reliant on US trade than all major economies and is most vulnerable to US tariffs. This chart somewhat contradicts J.P. Morgan's chart, following.
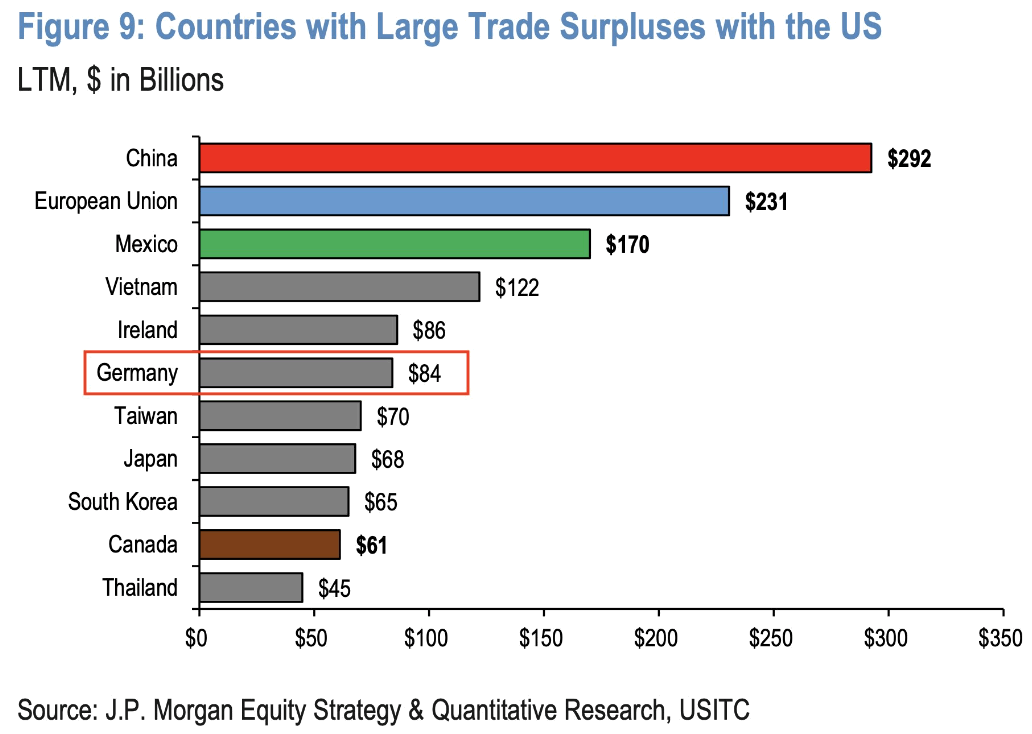
Countries and regions with with large trade surplus with US. Germany has roughly $84 billion in trade surplus with the US, making it the fifth-largest. The US has even bigger trade deficits with China, Mexico, Vietnam, and Ireland. Graph courtesy Holger Zschaepitz on X @Schuldensuehner.
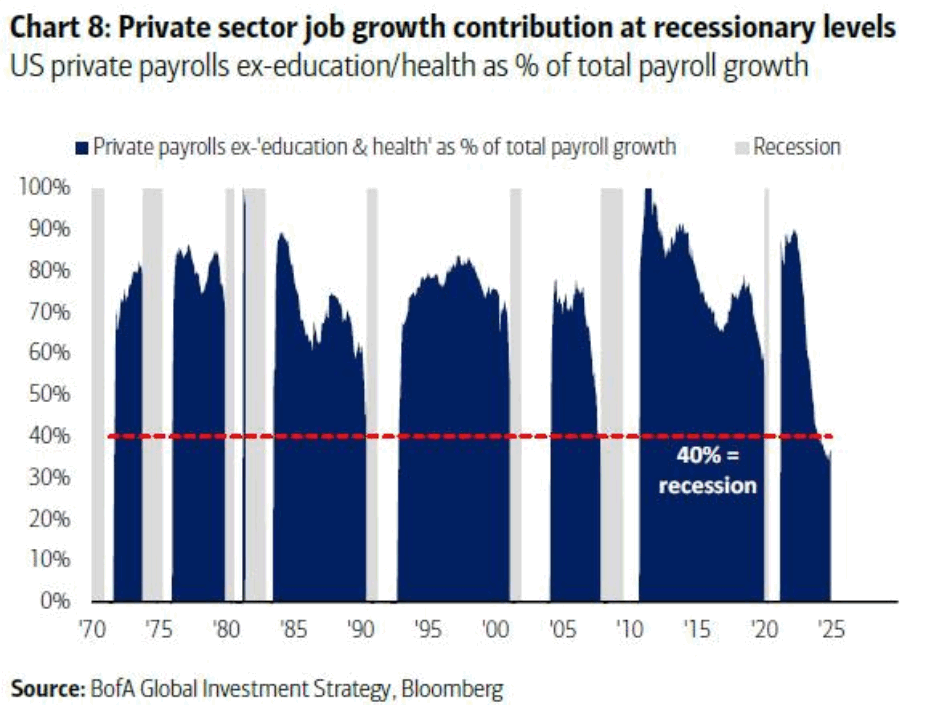
According to Bank of America, U.S. private sector jobs growth contribution is at recessionary levels.
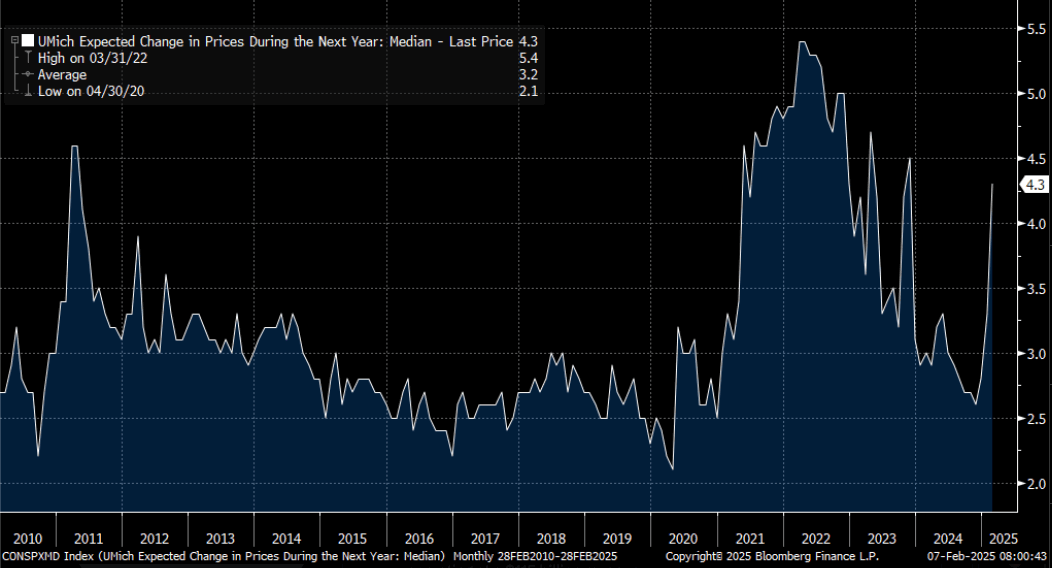
1-Year inflation expectations jump. Chart courtesy US government bond trader Ed Bradford on X @Fullcarry
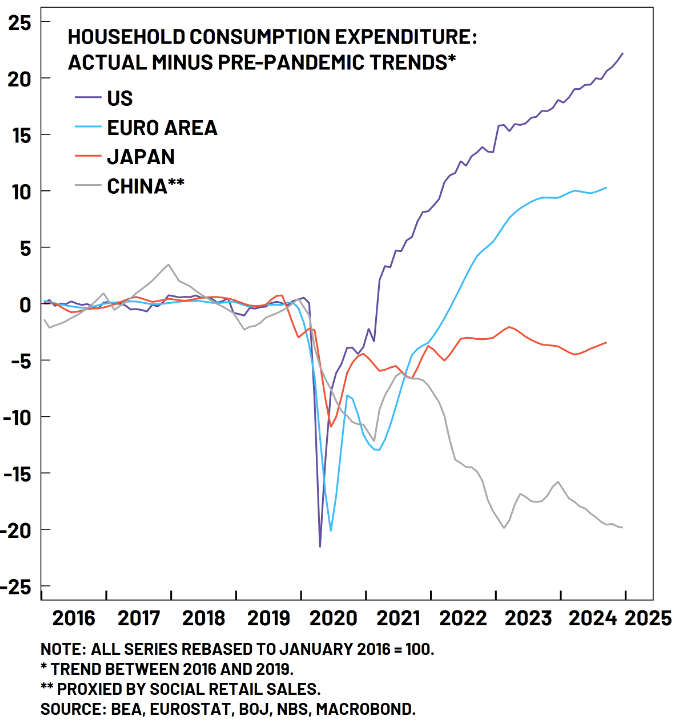
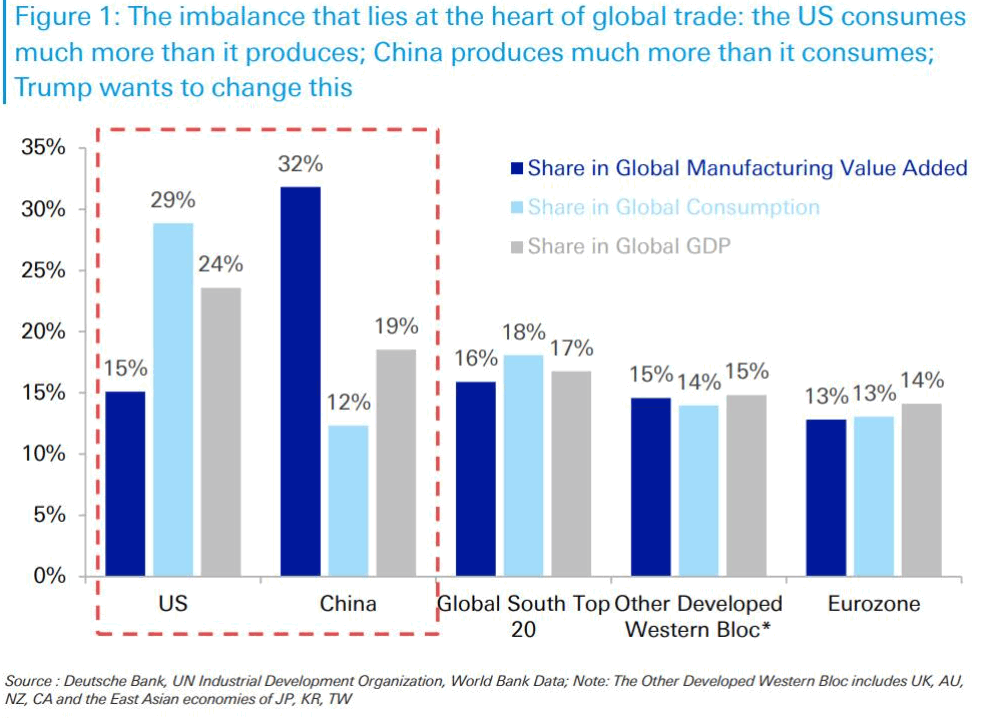
The US market economy continues to be the attractive destination for exporting nations. This chart highlights internal imbalances in major world economies since the pandemic. These imbalances are intertwined with global trade disparities. According to Shangai Macro Strategist on X @ShanghaiMacro, "the US must consolidate its fiscal policy to rein in excessive domestic consumption, while China needs to pursue the exact opposite path."
Below, chart further showing China's trade imbalance while detailing share in global manufacturing value add. Recent comments from Scott Bessent, US Secretary of the Treasury, called out China's economy is the most unbalanced economy "in the history of the world." Chart courtesy zerohedge on X @zerohedge.
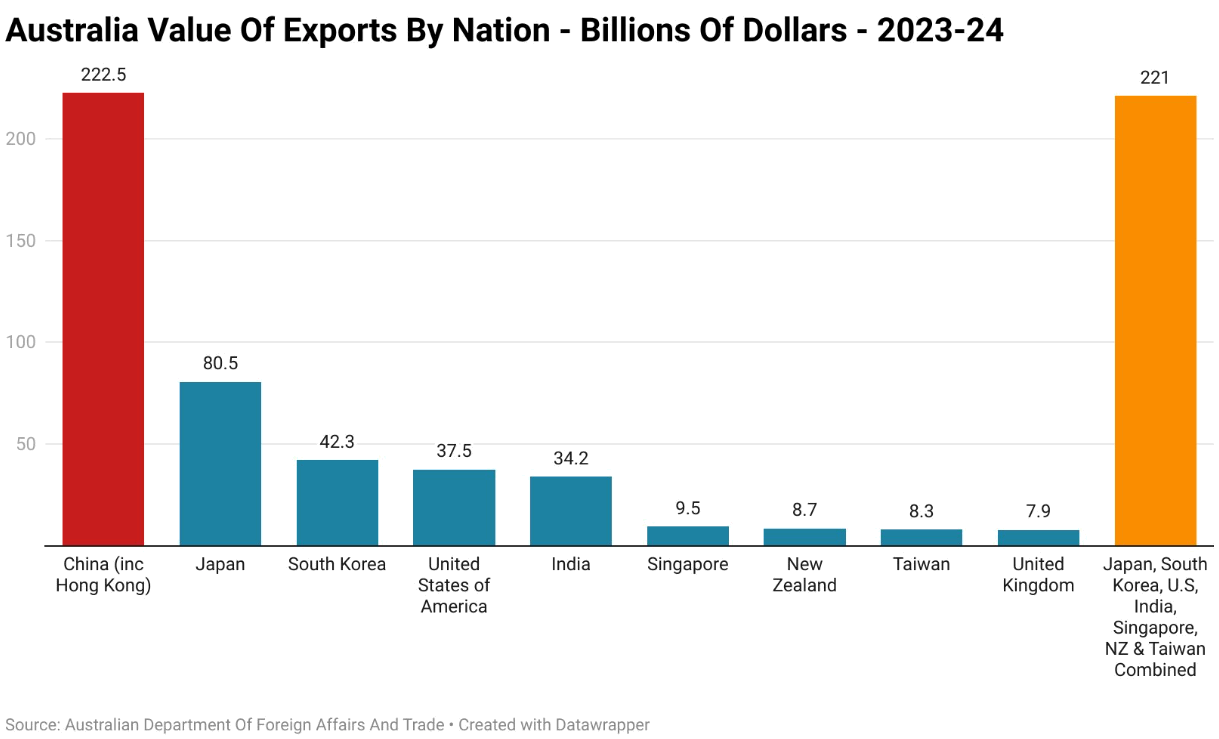
Meanwhile, Australia exported more to China in 2023-24 than to its next seven largest trading partners, combined.
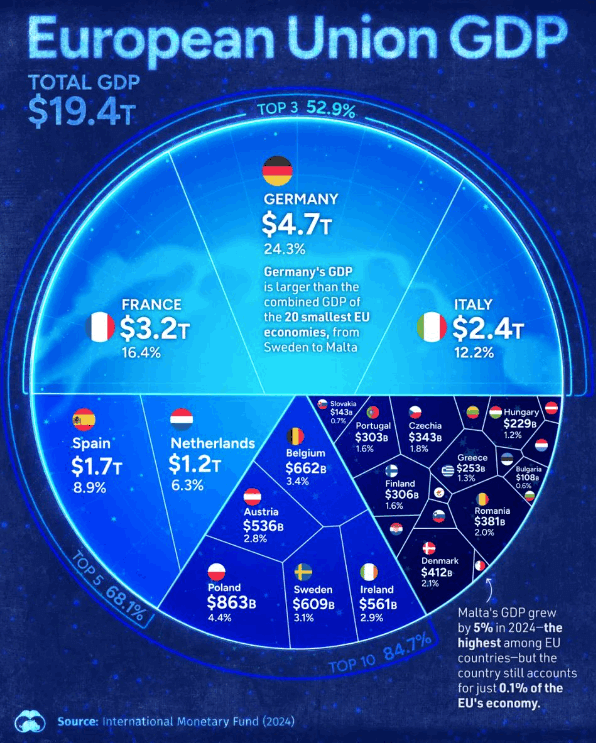
European Union GDP for 2024.
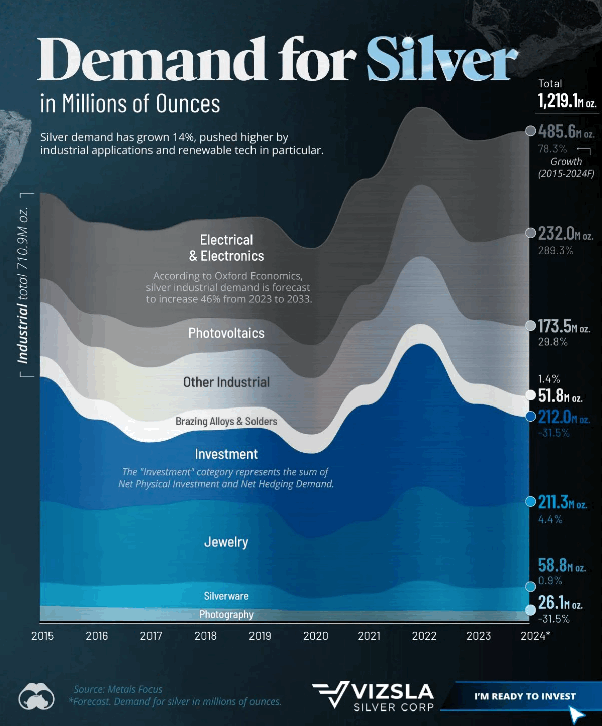
Electronics industry drives silver demand.
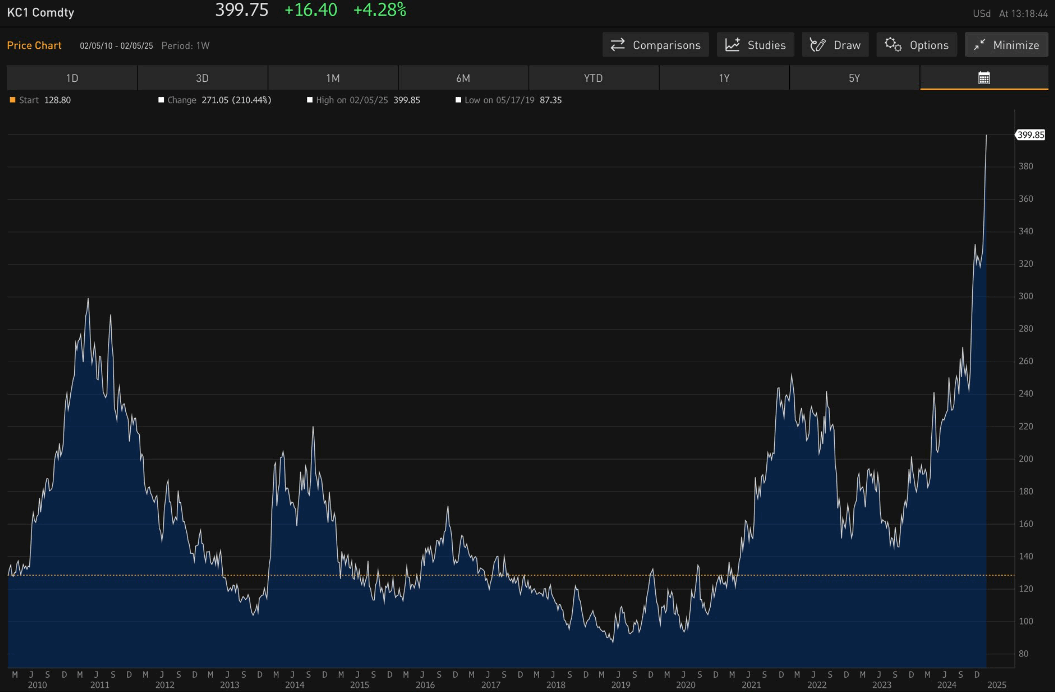
For coffee drinkers, futures (2010 to 2025) show coffee futures rising significantly. Chart courtesy Kevin Gordon, Director, Senior Investment Strategist with Charles Schwab on X @KevRGordon.
Share and subscribe
Thank you for reading. If you found this article useful or interesting, feel free to share it with others.
